
A data center announcement usually arrives with three numbers: investment, megawatts and jobs.
Each tells us something. None, on its own, tells us who will capture the economic value.
An announced investment does not establish how much capital has been committed, drawn or spent. A capacity figure may describe an ultimate campus design rather than equipment installed and serving customers. An employment forecast describes an expected outcome, not an observed one.
The commercial picture emerges through the relationships underneath those numbers.
Who controls the land? Who supplies the electricity? Who finances construction? Who absorbs a delay? Who has committed to buy capacity? When does that commitment become revenue? Which parties receive payment before the project becomes profitable?
These are the questions behind the Australian AI Data Centre Commercial Tracker, a proof of concept I built with AI assistance.
The initial register contains 62 facilities and campuses, 39 tracking fields and 62 public sources, with records across all eight Australian states and territories. It includes AI deployments, AI-ready facilities and clearly labelled context facilities whose AI use is not established in the reviewed sources.
You can explore it here:
Open the Australian AI Data Centre Commercial Tracker
The purpose is to make the commercial structure easier to inspect, and to show where the public evidence stops.
The full-stack capitalist lens
For Full Stack Capitalist, the relevant unit of analysis is the connected project: its assets, counterparties, obligations and cash flows.
An AI data centre brings several distinct economic interests together.
The landowner has a property interest. The developer coordinates delivery. The operator provides the facility and its services. Equity investors supply risk capital. Lenders provide financing under contractual terms. Contractors and equipment suppliers deliver the physical infrastructure. Energy counterparties provide electricity or connection infrastructure. Customers contract for services or capacity.
Some organisations occupy several of these roles. Others participate in only one.
That distinction matters. A shareholder in an operating platform is not necessarily the registered owner of a particular campus. A property tenant is not necessarily the customer consuming compute. An electricity network provider is not necessarily the energy retailer or power purchase agreement counterparty.
A useful tracker must preserve those differences.
The analytical task is to follow a project through five connected layers:
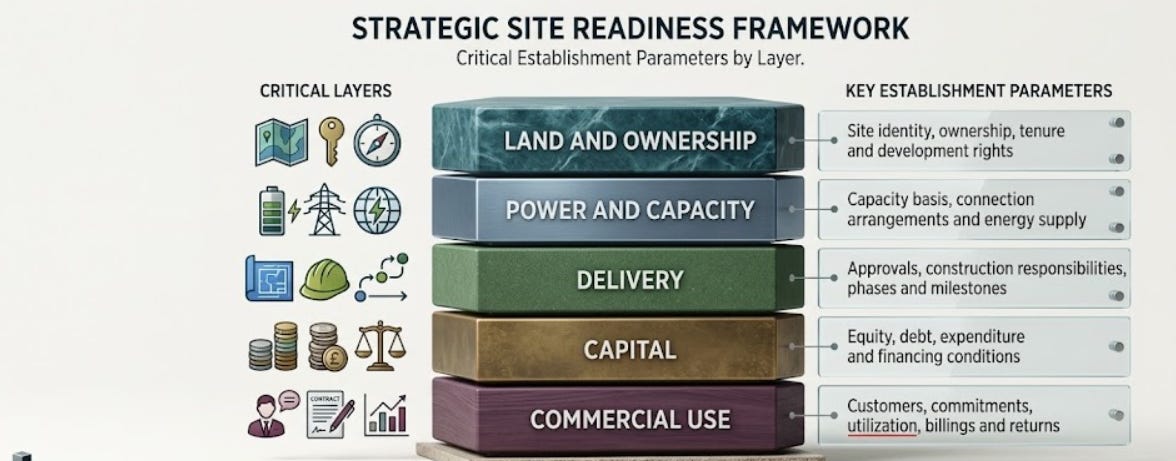
A public announcement may illuminate one layer while leaving the others largely undisclosed. The tracker makes that uneven visibility explicit.
Start with the identity of the asset
Before analysing economics, we need to know what the record describes.
Is it a single building, a multi-building campus, an expansion phase or a national investment program? Is the capacity figure attached to that specific asset? Does a financing announcement cover the campus, the operating company or a broader portfolio?
Without those boundaries, it is easy to count the same development more than once or attach a corporate commitment to the wrong project.
The register therefore distinguishes facilities and campuses from national and platform announcements. Campus phases sit within their parent record where the reviewed evidence supports that treatment.
This also helps with naming. Similar site codes can appear across different operators. A project name without its operator and location can be an ambiguous identifier.
Identity sounds administrative. It is the foundation of reliable commercial analysis.
Capacity needs a denominator, and a delivery stage
Megawatts are useful only when we know what they measure.
Published figures may describe IT load, utility supply, planned capacity or an operating installation. Other disclosures use maximum demand, MVA, cabinet counts or GPU counts.
Those measures answer different questions.
A planned campus capacity describes an intended scale. Built capacity describes a delivery milestone. Contracted capacity describes a commercial commitment under whatever terms apply. Billing capacity describes a further stage in monetisation.
The relationship between them is central to understanding progress, but they should not be treated as interchangeable.
The tracker retains the source’s capacity basis and separates the relevant disclosures. It does not convert GPUs or cabinets into megawatts. It does not combine battery capacity with data centre capacity. It does not calculate a national total by adding incompatible figures.
Where sources disagree, the discrepancy remains visible.
This makes the dashboard less convenient for producing a single headline number. It makes it more useful for examining an individual project.
Power is a set of arrangements
“Power secured” can conceal several separate questions.
Is there a documented grid connection? What infrastructure must be delivered? Is an energy supplier named? Has a power purchase agreement been disclosed? Are discussions still underway? Is the available figure a design requirement or an established supply arrangement?
Connection infrastructure and energy procurement deserve separate attention.
So do the commercial terms: price, duration, pass-through provisions and responsibility for additional costs. These can matter to the allocation of project risk, but public sources often do not establish them.
The tracker records what is disclosed and preserves the status of the arrangement. A negotiation remains a negotiation. An announced target remains a target.
Where pricing or contractual protections are unavailable, the field remains unknown. That is more informative than treating a named provider as proof that every power-related risk has been resolved.
Financing is not the same as expenditure
A financing headline is another point where scope matters.
An equity investment in a platform does not establish the amount allocated to a particular campus. A debt facility does not, by itself, establish how much has been drawn. An announced development cost does not establish expenditure to date.
To examine the capital structure, we need to distinguish:
Equity investors and their disclosed ownership interests.
Lenders, arrangers and the borrower where identified.
Financing commitments and evidence of financial close.
Project expenditure and broader investment announcements.
Debt terms, security and conditions where publicly available.
The tracker keeps platform-level disclosures separate unless the source explicitly assigns them to a named project.
This avoids a particularly consequential mistake: using a large corporate financing announcement to imply that a specific development is fully funded.
The same discipline applies to returns. Investment size is not a substitute for project revenue, cash flow, yield or internal rate of return.
The customer relationship is where many crucial questions remain
A named customer is useful evidence. The nature of the relationship matters just as much as the name.
A memorandum of understanding, a strategic partnership, a property lease and a contracted capacity commitment are different arrangements.
To understand commercial use, we would ideally establish the customer, the relevant facility, the committed capacity, the contract duration, the commencement conditions and the payment obligations.
We would then track how delivery progresses toward utilisation and billings.
Much of that information may be confidential or absent from the reviewed public sources. The dashboard therefore separates customer identity from the underlying commitment and from evidence of revenue.
A disclosed relationship is not automatically proof of rent received or capacity generating billings.
That is an essential boundary for a tracker intended to support commercial scrutiny.
Who is in the stronger negotiating position?
This is one of the most interesting questions, and one of the easiest to answer too confidently.
A company’s position in the infrastructure chain does not, on its own, establish its bargaining strength.
Ownership of a site tells us who holds an asset interest. It does not reveal the alternatives available to a customer. A construction award identifies a contractor. It does not disclose the contractor’s expected margin or its exposure to overruns. A customer announcement identifies a relationship. It may tell us little about termination rights or payment protections.
A factual assessment of negotiating position would require evidence such as exclusivity, pricing, security, take-or-pay obligations, termination provisions and responsibility for delay.
The tracker includes fields for disclosed negotiation rights and commercial commitments. It does not produce a bargaining-power score where those terms are unavailable.
The same reasoning governs “winners” and “losers.”
We can identify a documented contract award. We cannot automatically translate that award into realised profit. We can record a reported valuation change. We cannot treat it as cash proceeds from a completed sale.
The ambition is to trace value capture with evidence, rather than assign it from a company’s visibility in an announcement.
Second- and third-order economics
The economic footprint of a data centre extends beyond the facility itself. Examining that footprint requires the same attention to evidence and timing.
For this tracker, I use three levels.
First-order economics concern the project’s direct arrangements: land, construction, financing, energy and customer commitments.
Second-order economics concern documented effects around delivery and operation, including supplier activity, employment and property outcomes.
Third-order economics concern documented downstream activity, such as research, industry use or wider economic outcomes associated with the infrastructure.
These are organising categories for the register, not a claim that every effect can be cleanly isolated or attributed.
A forecast number of construction jobs is not an observed employment result. An expected wider economic contribution is not realised project revenue. A downstream research partnership is not evidence of a quantified productivity gain.
The register retains those distinctions and labels forecasts accordingly.
The question at every level is the same: what has been disclosed, what has happened, and what remains an expectation?
Value realization is a sequence of milestones
A project can advance physically while important commercial questions remain unanswered.
That is why the tracker follows separate milestones rather than compressing progress into a single score.
Land and tenure establish a site position. Approvals establish particular permissions. Construction records establish delivery activity. Power disclosures establish specific supply or connection arrangements. Customer commitments establish commercial relationships. Utilisation and billings provide evidence of use and monetisation. Cash-flow and return disclosures, where available, help establish financial outcomes.
None of these milestones should stand in for all the others.
This framework creates a practical research agenda. For each project, we can ask which milestones are supported by evidence, how old that evidence is and what disclosure would resolve the next important uncertainty.
An unknown field is therefore useful. It identifies the next question.
What AI accelerated
AI helped me assemble the interface, organise the tracking structure and turn the research into a searchable dashboard.
The result includes project dossiers, filters, side-by-side comparisons and evidence exports. It requires no login or backend database.
That acceleration creates room for more attention to the work that determines whether the tool is trustworthy: reading disclosures, checking scope, identifying conflicting figures and maintaining records as projects develop.
The dashboard is a manually maintained snapshot dated 9 September 2026, not a live feed.
Its 62 records are not an exhaustive census of Australian data centres or undisclosed AI deployments. A source’s access date does not establish that its project status is current. Published claims are attributed to their sources; they have not all been independently audited.
These limitations belong inside the product, where readers can see them.
An invitation to improve the evidence
I want this tracker to become more useful through better disclosures, corrections and clearer project boundaries.
If you work in development, energy, construction, financing or data centre operations, I would welcome primary sources that help establish:
Project ownership and land tenure.
Capacity definitions and delivery milestones.
Named contractors and financing counterparties.
Executed customer or energy commitments.
Observed commercial outcomes.
The full-stack capitalist question is how ownership, obligations and payments connect across the project.
Following those connections gives us a more precise way to examine Australia’s AI infrastructure buildout, and a clearer view of what we still do not know.
Explore the Australian AI Data Centre Commercial Tracker
Which missing disclosure would most improve your assessment of an AI data centre project?